- fluctuations in P and T

Materials Modeling at the Molecular Level
What to do with a molecular simulation
properties, behavior, performance
Laura Frink
Sandia National Laboratories
Computational Materials Science Dept.
lfrink@cs.sandia.gov
What to do with an MD or MC Code ????
Compute Average Properties !!!
Ensembles
Microcanonical, NVE
Canonical NVT
(N, V, temperature)
Grand Canonical
Isothermal-Isobaric, NPT
(N, pressure, T)
Thermodynamic Averages of momenta and positions
Temperature

Pressure

Excess Chemical Potential NVT ensemble:
![]()
![]()
Excess Chemical Potential NVE ensemble:
![]()
Widom Test particle insertion method:
Randomly select an inertion point in the volume
Calculate the potential energy, ![]()
Compute the exponential, and average
Thermodynamic Properties Related to Fluctuations
Fluctuations :

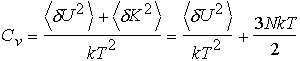
Constant-volume specific heat capacity 
Constant-pressure specific heat capacity 
Thermal expansion coefficient 
Isothermal Compressibility 
Thermal Pressure Coefficient 
Note that : ![]()
The fluctuations of interest depend on the ensemble of the calculation !!
Heat Capacity
Microcanonical ensemble Fluctuations in potential energy

Canonical ensemble Fluctuations in potential energy
Grand Canonical ensemble Fluctuations in potential energy and number of particles

Isothermal-Isobaric ensemble Fluctuations in the enthalpy,
![]()
Thermal Expansion Coefficient
Isobaric-Isothermal Ensemble Flutuation of volume*enthalpy product
![]()
Grand Canonical Ensemble
Fluctuations in potential energy and number of particles

where

Structural Averages - Distribution Functions
Pair Distribution Function:

If particle 1 is at r1, g(r12) is the probability of finding a second
particle at r2.
Thermodynamic properties:

Potential of Mean Force:
![]()
w(r) allows an accurate integration of the solvent degrees of freedom in solutions (see McMillian-Mayer theory).
Static Structure Factor:

S(k) may be measured with neutron or X-ray scattering, and describes the Fourier components of density fluctuations in the liquid.
Calculating the Pair Distribution Function
define a bin size Dr
ever M steps call g_of_r routine
loop over all i
loop over j>i
compute the distance between i and j, rij
calculate the bin number (ibin = rij/Dr+1)
add 2 to g(ibin) (one for each particle in the pair)
at end of run
compute the volume of each bin
compute (nid) = the number of particles that would be in the bin if the density was uniform and equal to the bulk density
divide each entry of g(ibin) by (N*nid*# of calls to g_of_r)
Dynamical Averages - Correlation Functions
(Molecular Dynamics Only)
Correlations are defined by: ![]()
where

the limits are: low correlation:![]()
high correlation:
Things to keep in mind
Transport Coefficients


Link between transport coefficients and integral over time correlation functions are given by Green-Kubo relations which come from Linear Response Theory
Lab 3 -- what to do with a molecular simulation
We will provide you with an MC code that calculates the pair distribution function as well as the chemical potential of the fluid. The goals are:
1. Using the following input - compute and plot the radial distribution functions g(r) as a function of r
Llj = T Run 1: pshift = 2.0
rcut = 2.5 density = 0.01
T* =0.8
Nmax = 100,000
Neq = 50,000 Run 2: pshift = 0.2
Nsub = 1,000 density = 0.8
Nneigh = 500
Tau_block = 100 Run 3: pshift = 0.1
Ngofr = 100 density = 1.4
nbins = 100
Nac = 1
NCX=NCY = 10
xa,xy=0.5000
The g(r) data may be found in the file ‘gofr.out’, and may be plotted using the gnuplot utility. To run the plotter:
a. type gnuplot
b. at prompt gnuplot>, type plot ‘gofr.out’ usi 1:2 with lines
Describe the differences in g(r) that you observe.
What feature(s) distinguish a solid phase from the fluid phases ?
How do gas and liquid phases differ ?
Based on your insights, what do you expect to happen to the density of a fluid when a surface is immersed in that fluid? What if the fluid-surface interactions are varied from unfavorable (nonwetting) to very favorable (wetting) ?
2) Using the isotherm in problem 1 (T*=0.8) compute the chemical potential and pressure as a function of the density of the fluid. Locate the coexistence pressure, liquid and fluid densities.
3) In the MC code, implement a calculation of the constant volume heat capacity. Compute the variation of the heat capacity with temperature and density.
Extra things to do....and a few more project ideas
1) Determine the coexistence points at a variety of temperatures in order to find the coexistence curve. Estimate the location of the critical point.
2) Implement a routine to calculate the velocity autocorrelation function and compute the diffusion constant or other transport properties.
3) Explore the effects of using more sophisticated potential models. How do more sophisticated potentials affect performance of the codes, how do they affect the qualitative and quantitative results ?
4) Extend the programs to 3-dimensions and/or mixtures. Compare phase diagrams in 2D vs. 3D, or mixtures vs. pure systems.
5) Add a one body external field to the code (i.e. add a surface). Look at the density distribution of fluid near a surface as a function of the surface-fluid interaction strength.